How to Enable Developer Tools in Chrome
To troubleshoot some more technical questions in the Centralized Database (CD), we may need you to enable developer tools in your browser to get more specific information about your error. Please use the instructions below.
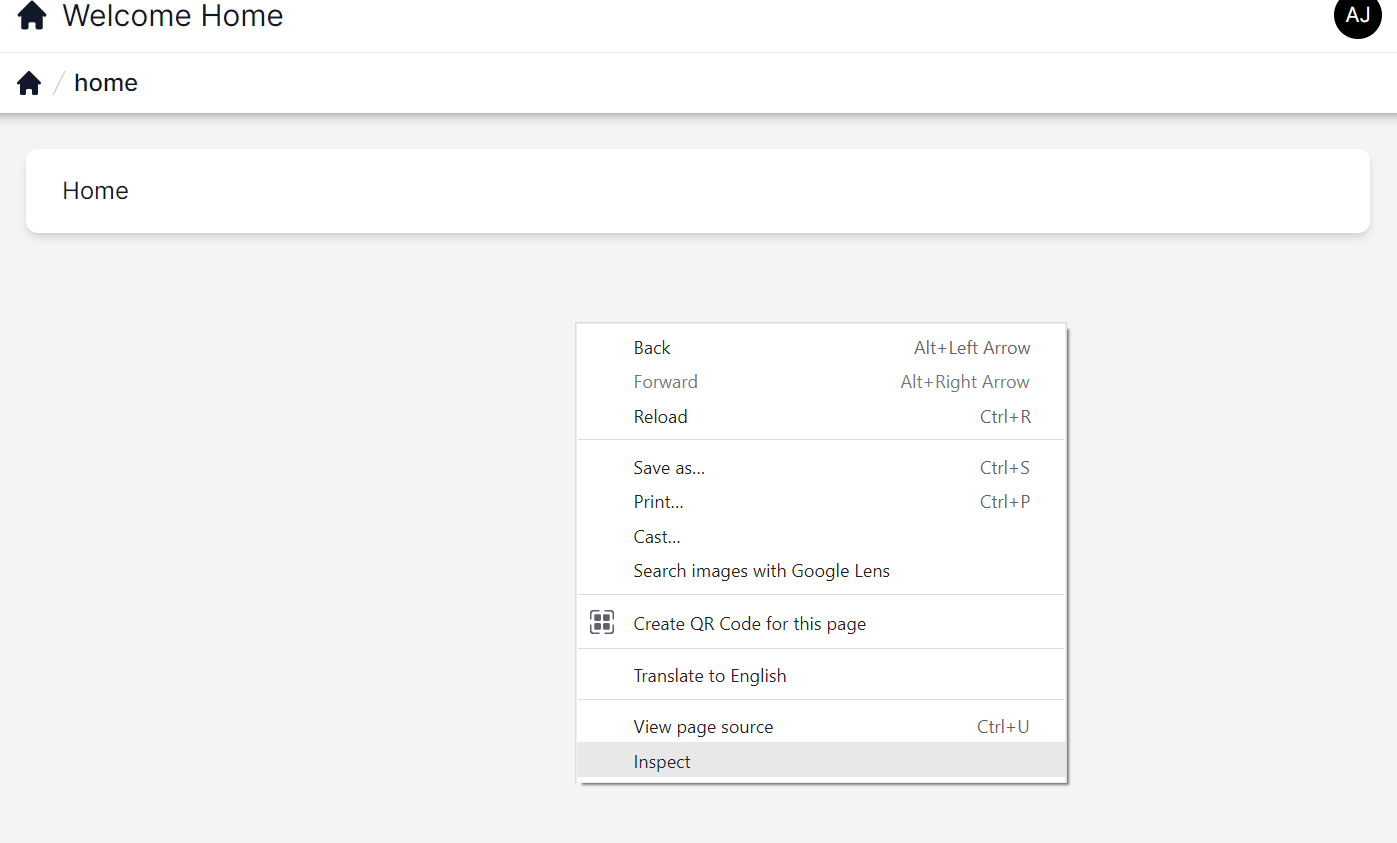
Right click on a blank space on the page and select Inspect from the menu.
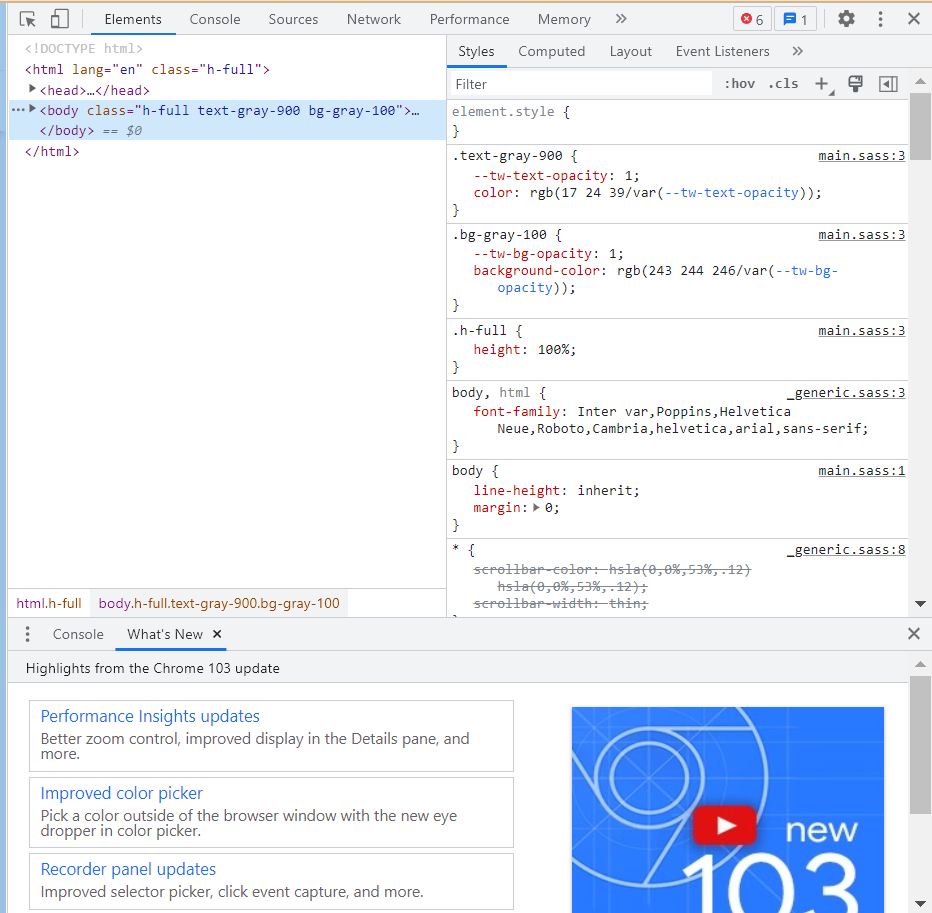
The developer tools should open in your Chrome browser.
3. There are tabs along the top that you will be asked to use. Select the name on the top to open that tab.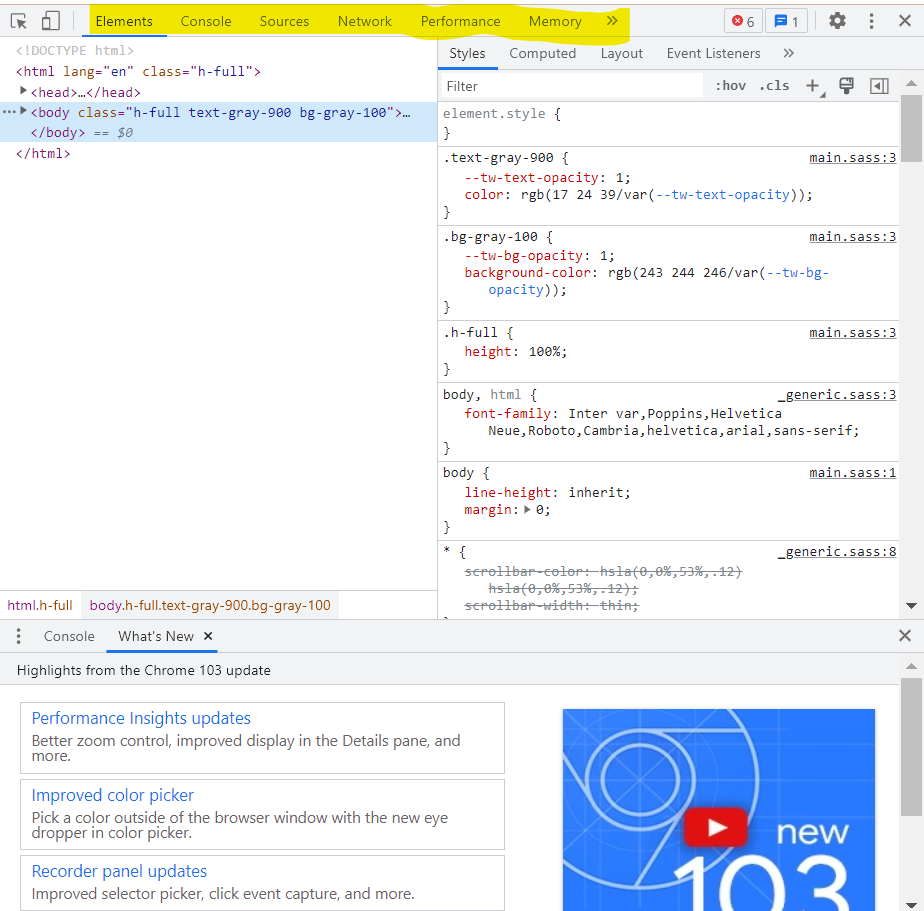
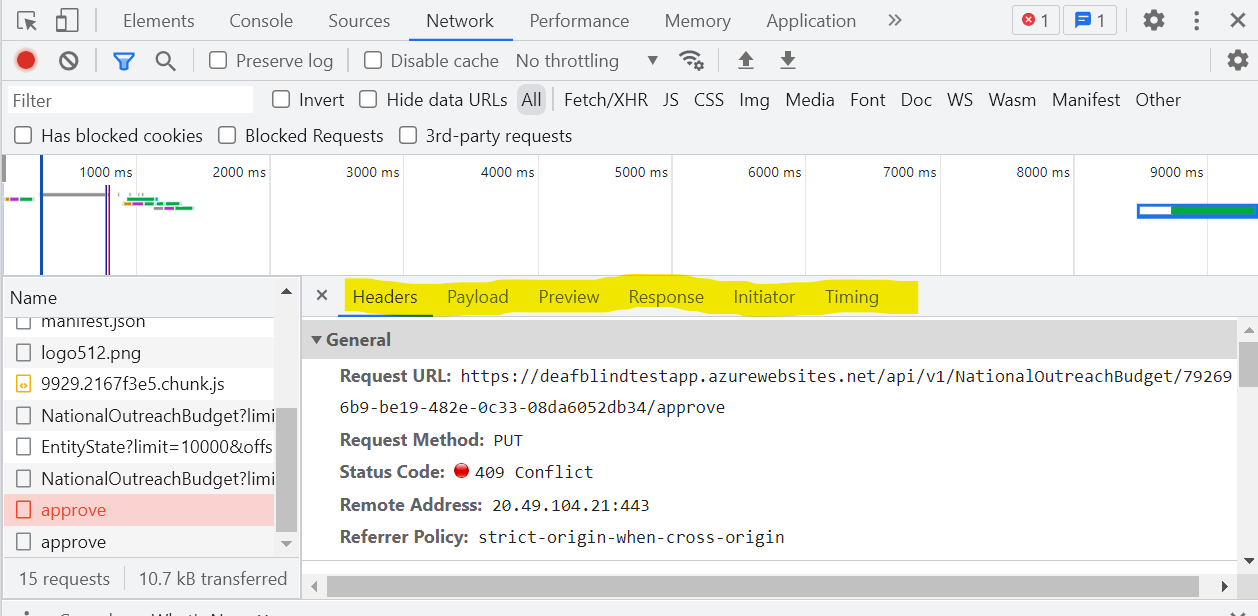
4. The Network tab will likely be the most useful while troubleshooting. Select Network at the top to view the tab. When an error occurs, you will see a red line with red text to indicate an error.
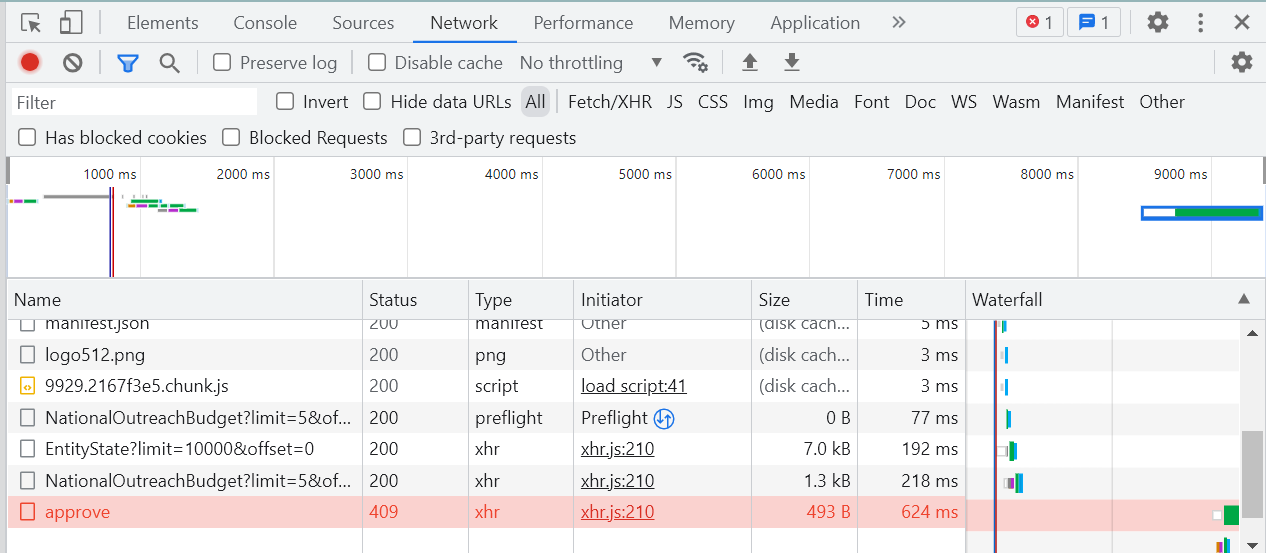
5. A single click on the line will show more details.
6. You may be asked to use the header tabs in this section to provide more details for your error.